Questions about scaling the content app

Problem:
I’d like to optimize the deployment of the content-app, without overloading the system

Expected outcome:
Better understanding of the resource requirements of the content app and recommendations how to scale it

Pulpcore version:
3.21.5

Pulp plugins installed and their versions:

  • rpm 3.18.11
  • file 1.11.1
  • container 2.14.3
  • certguard 1.5.5
  • ansible 0.15.0

Operating system - distribution and version:
RHEL 8.8

Other relevant data:
Hi!

We’re running Pulpcore 3.21 as part of a Katello 4.7 deployment, which is mostly used to sync RHEL and CentOS RPM repositories and serve them to clients (no containers, no ansible, but a few files are present).

The machine has 16 cores and 32GB RAM, and has been struggling with the API memory leak, which prompted me to also look at the content app. (No need to worry, I don’t think the content app leaks memory, but I still would like to better understand how it uses it).

The content app gets configured with 17(!) workers on that box by the installer:

The number is based on the Gunicorn docs, which recommend 2×CPU+1 while at the same time saying that 4-12 should be enough in most cases.

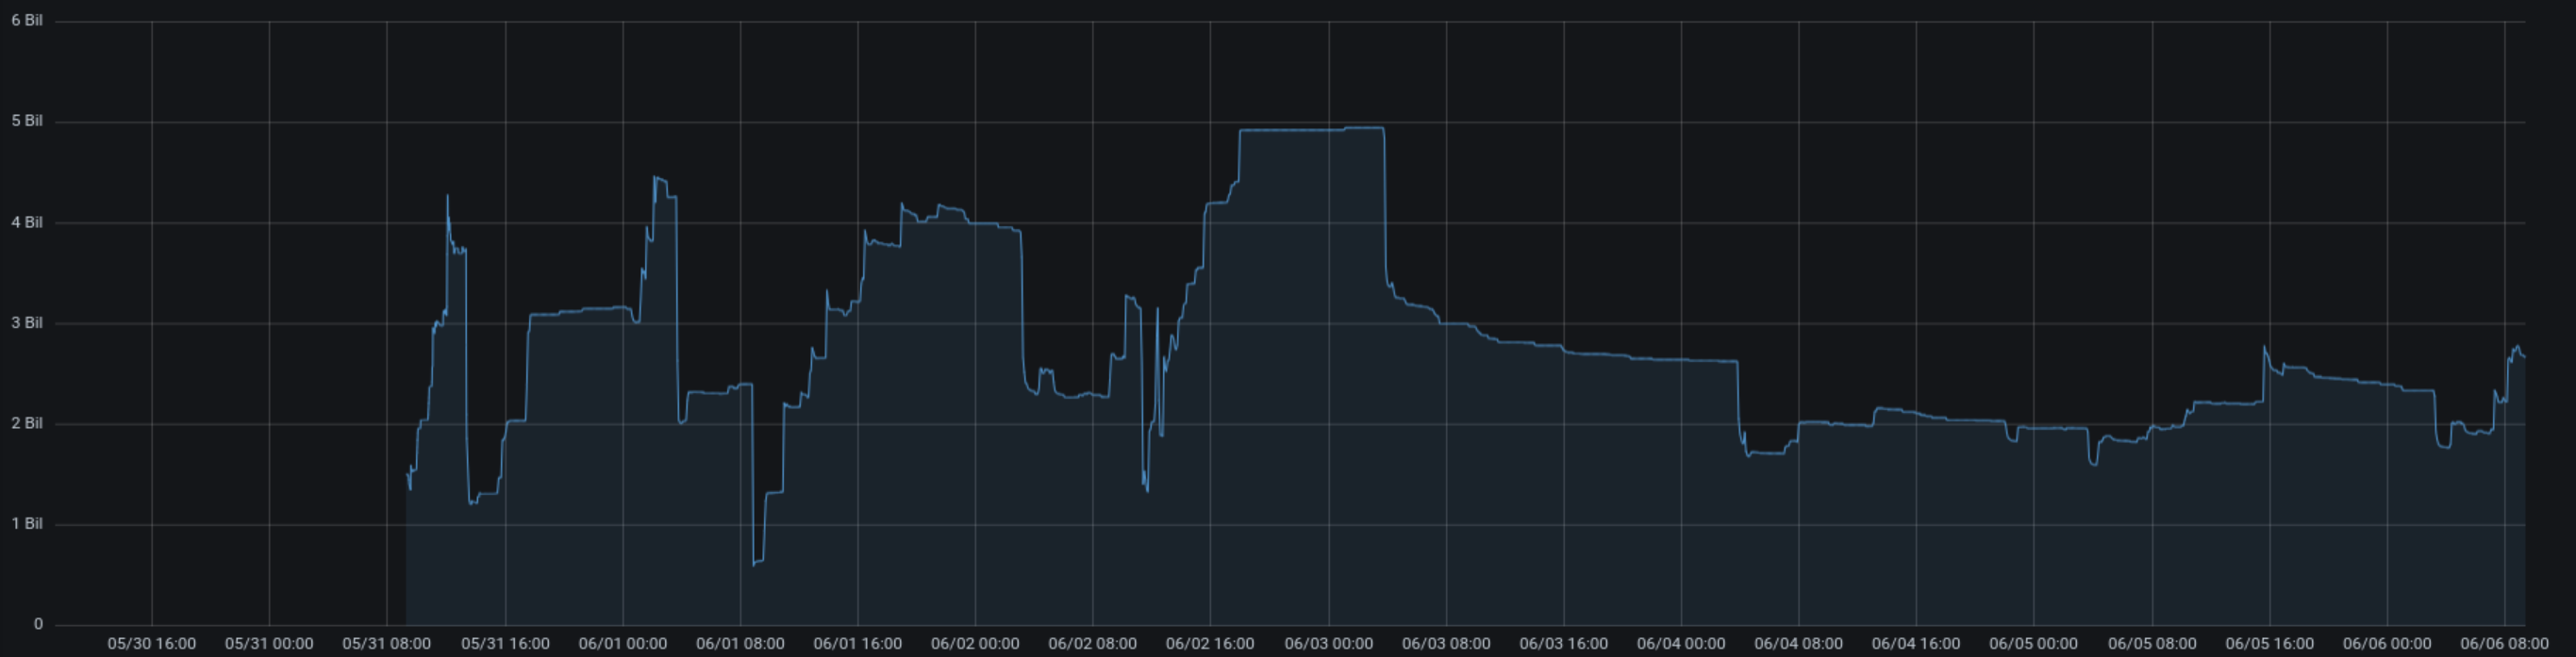
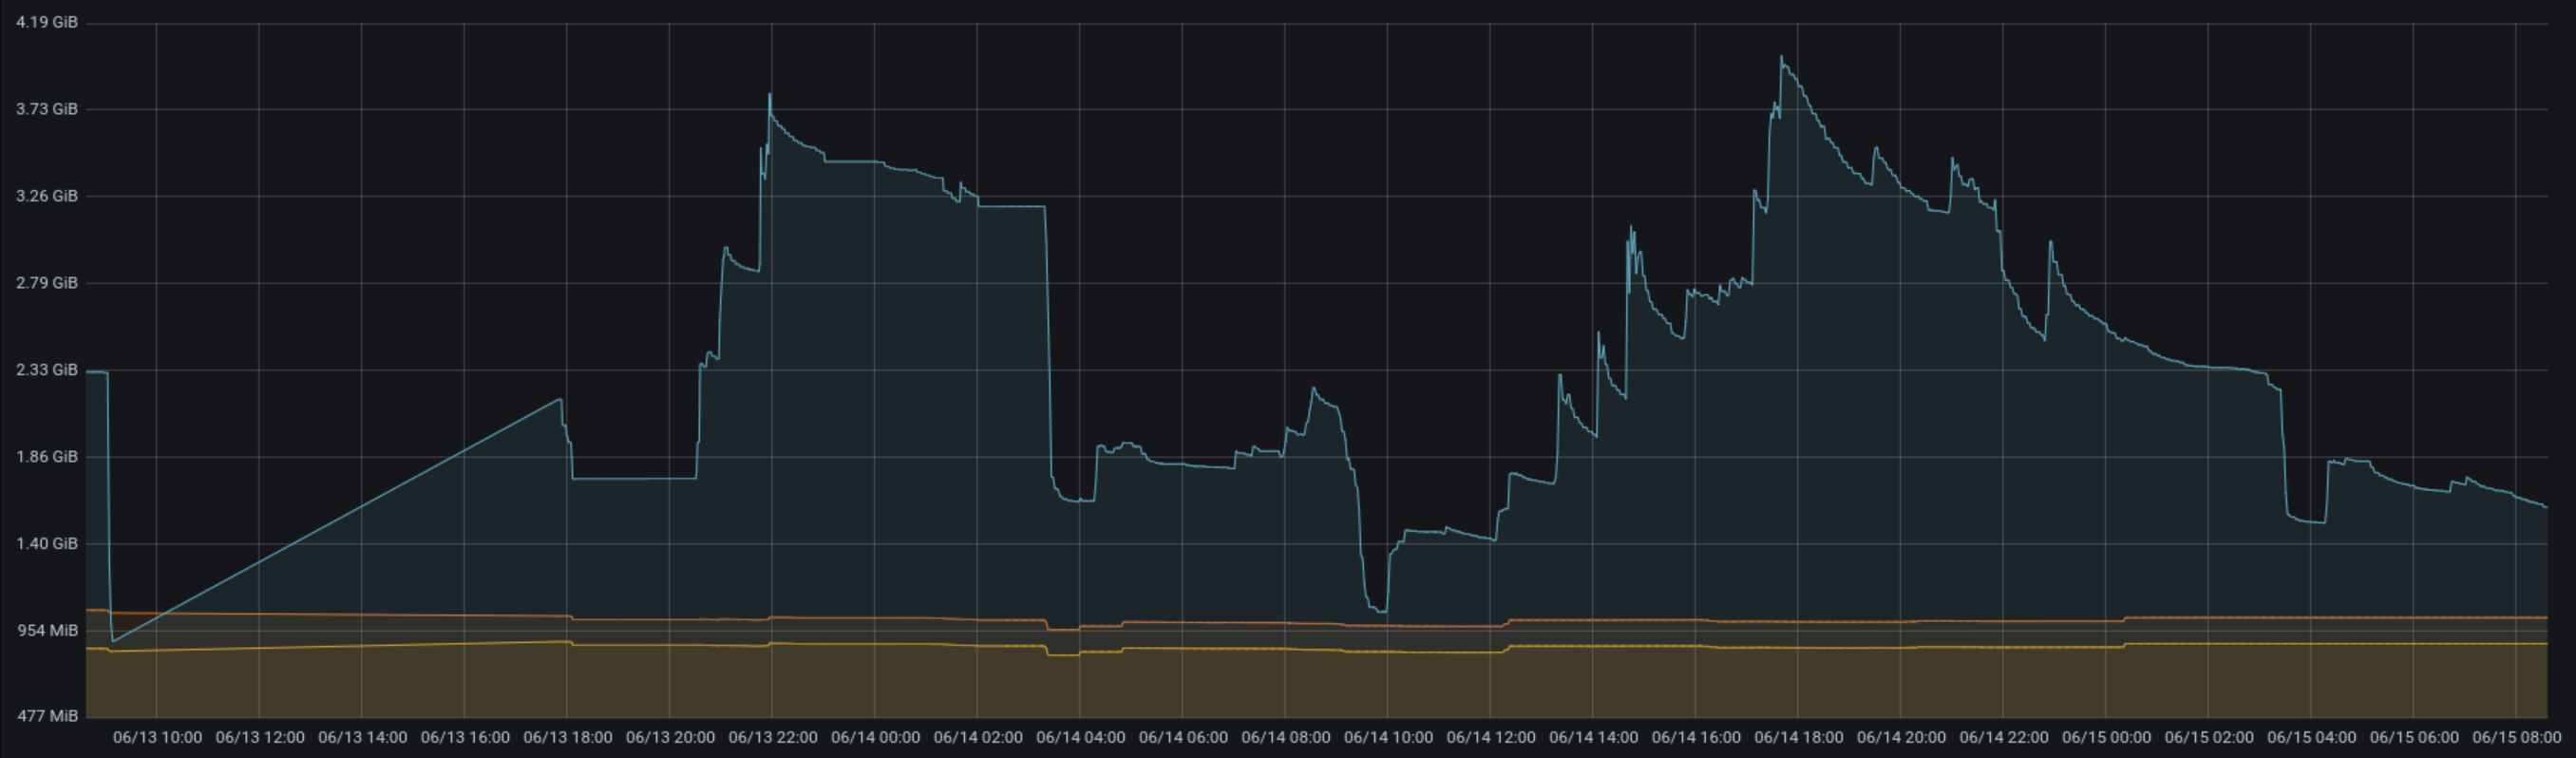
I’ve been watching the memory usage of that setup in the recent days, and seen it peaking at roughly 4.25GB (= 250MB per worker). When looking closer at the usage changes and correlating them with logs, it seems that when the app serves many RPMs “at the same time” (think of a downstream consumer downloading many packages) the memory usage spikes up, while it falls down when many repodata files are transferred.

With that observation in mind, I came to the following questions:

  • Should that setup run with fewer wokers? My gut feeling is to half the number and see how it works out?
  • Should we apply the same “max requests” recycling as we do with API workers? Probably at different limits then (max 500, jitter 50?)…
  • The grow/shrink timing above hints that the memory is “recycled” when a new (smaller) file is served and not when the big file finished transferring. Can we improve this behaviour?

I think you’re looking at the right things. The RPM Content Service Performance and Scale Testing | software repository management assumes object storage is being used, but here you’re using pulp-content to actually serve the binary data itself so that’s different.

We need data on the memory profile of pulp-content as it’s serving lots of RPMs over time. I think we want these two questions answered:

  1. Does memory usage grow endlessly or does it level out at some point? Am I reading right that it stays flat at ~250MB?
  2. If it levels out, what is that point? Is 250MB the number here?

In terms of how many to deploy, I think the metric that needs analysis is the latency time to first byte (TTFB). If decreasing the number of pulp-content processes does not decrease the TTFB then decreasing it is a good idea. You’ll probably see some change in the TTFB as you increase or decrease the pulp-content for any given consistent request load, so it’s a subjective tradeoff between the resources needed for more/fewer pulp-content processes versus the TTFB latency.

Maybe max-requests recycling is a good idea. I’m not sure without more of an analysis. If it reduces it only for it to then rise back to it’s steady state amount of 250MB then I’d say do not use it. I believe process recycling is best used when memory is never freed which shows as monotonically increasing memory usage over long timescales.

Thanks for this link! I remember seeing the post at some point, and then totally forgot >.<

You bring up a great question that I didn’t answer in my original post: what is the performance I want to keep.
Looking at the logs of the system, I can find a peak of 500RPS if I look with a “one second” granularity,
but it quickly drops to 1600RPM (so 26RPS) with “one minute” granularity and 5600RPH (so 2RPS!) with “one hour”.
While we obviously should be able to handle the peaks, I wanted to underline the fact,
that this particular system is not very loaded (the 95th percentile is more like 80RPS).

The next step for me was to establish how much more room does the system have (even if unused).
In the post you say that you ignore the redirect, as you do not want to benchmark MiniIO.
Given that we are actually serving the content via pulpcore-content,
I think we should incorporate it in our benchmark.

Using vegeta, I get to ~3500RPS with reasonable latencies:

# echo 'GET https://127.0.0.1/pulp/content/ACME/Library/custom/evgeni/zoo/Packages/w/walrus-0.71-1.noarch.rpm' | ./vegeta attack -duration=15s -rate=3500 -insecure | ./vegeta report
Requests      [total, rate, throughput]         52500, 3499.98, 3487.08
Duration      [total, attack, wait]             15.056s, 15s, 55.514ms
Latencies     [min, mean, 50, 90, 95, 99, max]  4.414ms, 378.844ms, 156.66ms, 773.74ms, 1.371s, 4.563s, 8.855s
Bytes In      [total, mean]                     129150000, 2460.00
Bytes Out     [total, mean]                     0, 0.00
Success       [ratio]                           100.00%
Status Codes  [code:count]                      200:52500  

Throwing away the reply body gives even better latencies:

# echo 'GET https://127.0.0.1/pulp/content/ACME/Library/custom/evgeni/zoo/Packages/w/walrus-0.71-1.noarch.rpm' | ./vegeta attack -duration=15s -rate=3500 -insecure -max-body=0 | ./vegeta report
Requests      [total, rate, throughput]         52501, 3500.03, 3485.63
Duration      [total, attack, wait]             15.062s, 15s, 61.682ms
Latencies     [min, mean, 50, 90, 95, 99, max]  6.452ms, 69.957ms, 70.752ms, 93.815ms, 106.199ms, 171.688ms, 410.512ms
Bytes In      [total, mean]                     0, 0.00
Bytes Out     [total, mean]                     0, 0.00
Success       [ratio]                           100.00%
Status Codes  [code:count]                      200:52500  

I guess I could reach even higher RPS with a bit of work – vegeta failed with “too many open files”
when I tried higher -rate numbers and one can’t reach higher RPS than -rate for obvious reasons :wink:

I’ll experiment with how many content workers I can remove while keeping the 3000+RPS.

Now to memory. It definitely doesn’t grow endlessly.

Here is a screenshot from systemd_exporter looking at our pulpcore-content.service Memory usage:


The last restart of the service was on 2023-06-01 (which you can see at the dip below 1GB), the rest is continuous service, serving RPMs to our users.

I’d say the “normal” usage is in the 2-3GB range (given 17 workers, 120-175MB/worker), the 4-5 GB (230-290MB/worker) peaks are when multiple clients request different content simultaneously. But as you can see, it’s also given back after some time.

I could try scripting a more reproducible parallel workload generator (based on your post) and see if I can get the usage higher with that, if you want? The above tests with vegeta is the tiny uptick to 2.7GB on the right at 08:00.

1 Like

If someone wants to try (I have no time today), there is now https://github.com/evgeni/locust-rpm-user/blob/devel/locustfile.py :slight_smile:

So after playing around a bit with the above locust script, and thinking to found a memory leak… I questioned by metrics and found some nasty surprise in there. Better now than later, huh?

So what did I learn?

  1. The value systemd displays in systemctl show <unit> is based on what the cgroup memory controller reports, and that includes all the filesystem caches etc (see the kernel documentation for the memory controller), you can think of it as “all the memory the process/group ever touched”. That means that a IO heavy process (like pulpcore-content is, when serving content directly) the number will easily grow to multiple gigabytes “used”, while the “used” are really just filesystem caches the kernel can drop at any time. This makes this number pretty much useless as a metric to track “how much memory does my app consume”.
  2. Instead, we could use “RSS” (Resident Set Size), which is all the memory the process really allocated (and is not a cache, or swapped out). Well, it’s not really allocated, as it also contains the memory the process might have inherited from a parent process. As we use --preload in our Gunicorn configuration, the main process allocates memory for the whole app and then fork()s off the workers, which share the memory pages with the main process. That means that again, we’re over-counting memory (but it’s still much better than before).
  3. Enter “PSS” (Proportional Set Size), which tries to accommodate for that problem by calculating the “shared” part of the memory and dividing it equally between the processes sharing it.
  4. There is also the notion of “USS” (Unique Set Size), which is the memory the process owns alone (so without all the shared pages) and commonly referred to as “the memory you get back if you kill the process”.
  5. And there is also “WSS” (Working Set Size), which is the memory the process needs to perform a task (which can be smaller than the memory it currently “owns” if the task is small, or bigger…)

If you want to learn more, I recommend starting off at ELC: How much memory are applications really using? [LWN.net], How To Measure the Working Set Size on Linux and Working Set Size Estimation

With that knowledge at hand, I went back to my actual system. To get the memory data from systemd, I was using systemd_exporter (with a patch, as the original version does not actually fetch the memory data from systemd). Once realized this is the wrong number to look at, I looked at other tools that can provide me with memory stats and landed on process-exporter, which does export RSS and PSS.

Using that, and comparing to what systemd gives me, I get the following graph for the last two days of my box:

blue is systemd/cgroups, orange is RSS, yellow is PSS, each for the “whole” pulpcore-content group (= 1 main process and currently 9 workers)

Both RSS and PSS are pretty flat at roughly 1000/900MB, which is good. That makes about 100MB per worker right now. When I look at the system directly, I see some workers at 90-ish MB RSS, some at 130 MB RSS (top/ps do not show PSS), but overall this is stable and nice. I think for any calculation based on this, I’d go with 150MB/worker, which should give sufficient head space for now, while still being close to reality.

4 Likes

Outstanding analysis, sir - this is great work!